
Understanding Diesel Particulate Filter (DPF) differential pressure is crucial for maintaining a healthy diesel engine. A clogged DPF can lead to reduced performance, increased fuel consumption, and costly repairs. But What Is Normal Dpf Differential Pressure Kpa, and how can you determine if your DPF is functioning correctly? This article delves into a formula used to assess DPF breathing efficiency, specifically focusing on the relationship between differential pressure and Mass Air Flow (MAF).
A common formula, originating from Toyota, suggests that a DPF is operating efficiently if the differential pressure (kPa) divided by the MAF (gm/sec) results in a value below 0.2. This calculation requires data collected during a road test with the DPF temperature stable above 450°C. For instance, a differential pressure of 2 kPa with a MAF of 25 gm/sec results in a value of 0.08, indicating a healthy DPF. Conversely, a 6 kPa differential pressure with the same MAF yields 0.24, suggesting a restricted DPF.
Testing the DPF Differential Pressure Formula
This formula was tested using a PicoScope and a WPS500 pressure transducer on two non-Toyota 2.0-litre diesel engines. It’s important to note that there were some variations in the testing procedure:
- Back Pressure vs. Differential Pressure: A WPS500 measured back pressure before the DPF, not the differential pressure across it.
- DPF Temperature: The DPF temperature was not consistently above 450°C during testing.
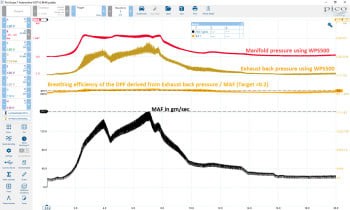
- Manifold Pressure Measurement: A WPS500 was also used to measure inlet manifold pressure.
To calculate MAF in gm/sec, a specific math channel was applied in PicoScope, utilizing engine capacity, volumetric efficiency (VE), RPM, and Manifold Absolute Pressure (MAP). The formula, incorporating these parameters and converting to the necessary units, is as follows:
LowPass(freq(A),50)*(2.0*0.8)*(B+1)/2*1.223/60
Where:
Arepresents the crankshaft signal for RPM calculation.Brepresents the manifold pressure measured by the WPS500.2.0represents the 2.0-liter engine displacement.0.8represents a typical VE value for turbocharged diesel engines.1.223is the air mass in gm/L at sea level.
To convert the exhaust back pressure from bar to kPa, the following formula was used:
D*100
Where D represents the exhaust back pressure measured by the WPS500.
Finally, to assess DPF breathing efficiency, the complete formula was applied:
(D*100)/(LowPass(freq(A),50)*(2.0*0.8)*(B+1)/2*1.223/60)
The first test vehicle, a BMW 320D, showed values mostly below 0.2, indicating good DPF health, except during Wide Open Throttle (WOT) where it slightly exceeded 0.2.
The second vehicle, a SEAT Alhambra, consistently exceeded 0.2 during acceleration, suggesting potential DPF restriction. However, the vehicle performed well under WOT, raising questions about the definitive nature of the results given the test variations.
Using Serial Data for DPF Efficiency Calculation
Using serial data directly from a scan tool simplifies the process. By dividing the DPF differential pressure (kPa) by the MAF (gm/sec), you can quickly assess DPF health.
For example, a differential pressure of 15.894 kPa and a MAF of 97.69 gm/sec result in a value of 0.163, indicating a healthy DPF.
Conclusion
While the formula of DPF differential pressure divided by MAF provides a useful indicator of DPF health, it’s crucial to consider potential variables like testing methodology and operating conditions. Ideally, using actual differential pressure data from a scan tool offers the most accurate assessment. However, understanding this relationship and applying these calculations can offer valuable insights into the performance of your DPF system.